Rajasthan Board RBSE Class 11 Economics Chapter 6 Classification of Data
RBSE Class 11 Economics Chapter 6 Text book Questions
RBSE Class 11 Economics Chapter 6 Multiple Choice Questions
Question 1.
In an exclusive series :
(a) Both class-limits are considered
(b) Lower limit is removed
(c) Upper limit is removed
(d) Both the limits are removed
Answer:
(c) Upper limit is removed
Question 2.
The frequency of each variable value in an individual series is:
(a) Equal
(b) Unequal
(c) Both the above situations are possible
(d) None of these is true
Answer:
(d) None of these is true
![]()
Question 3.
The main objective of classification is:
(a) To give a concise form to the large group of data-items
(b) To lend flexibility to the data-items
(c) To lend stability to the data-items
(d) To lend mutual exclusivity to the data-items
Answer:
(a) To give a concise form to the large group of data-items
Question 4.
The following series is:
| Marks obtained | 1 | 2 | 3 | 4 | 5 |
| Number of students | 20 | 4 | 2 | 3 | 1 |
(a) Individual
(b) Discrete
(c) Continuous Inclusive
(d) Continuous Exclusive
Answer:
(b) Discrete
Question 5.
If the lower limit (L1) of a class is 10 and the upper limit (L2) is 20, then the mid-point is:
(a) -15
(b) 10
(c) 15
(d) 30
Answer:
(c) 15
Question 6.
Which of the following fact is not numeric:
(a) Height
(b) Weight
(c) Unemployment
(d) Age
Answer:
(c) Unemployment
RBSE Class 11 Economics Chapter 6 Very Short Answer Type Questions
Question 1.
Write the names of the two types of attribute classification.
Answer:
- Ordinary or Binomial Classification
- Multiple-attribute Classification
Question 2.
What is meant by classification based on variables?
Answer:
Variables are the values, whose values change, and classification based on it, is called classification on the basis of variables.
![]()
Question 3.
What is meant by variable?
Answer:
The facts that can be expressed in numerical form, and whose values keep changing, are called variables.
Question 4.
Series are of how many types? Write their names.
Or
How many types of series are there? Write their names.
Answer:
Statistical series are divided into three types based on their formation
- Individual Series
- Discrete Series
- Continuous Series
Question 5.
What are class-limits?
Answer:
The boundaries of the class are called class-limits. The lowest value of the class is called lower limit of the class and the highest value of the class is called upper limit.
Question 6.
How is mid-point calculated?
Answer:
Mid point =
Question 7.
While finding cumulative frequency, which limits are used in ‘less than’ and ‘more than’ formats?
Answer:
Upper limit is used in ‘less than’ and lower limit is used in ‘more than’ while finding cumulative frequency.
RBSE Class 11 Economics Chapter 6 Short Answer Type Questions
Question 1.
What do you understand by classification of data-items?
Answer:
Classification is the process of arranging the compiled facts into homogeneous groups or classes or sub-classes according to their various qualities and properties.
According to Secrist :
“Classification is the process of arranging data into sequences and groups according to their common characteristics, or separating them into different but related parts”.
Question 2.
What are the main objectives of classification?
Answer:
Following are the main objective of classification :
- The main objective of classification is to eliminate the complexity of collected data-items (figures) and give them a simple and brief form.
- With the help of classification, the similarty-dissmilarity of facts is clarified.
- The purpose of classification is to make facts comparable.
- The purpose of classification is to make a logical arrangement of the data.
- The purpose of classification is to provide scientific basis to the data.
- The purpose of classification is to increase the usefulness of data.
- The purpose of classification is also to form the basis of tabulation.
![]()
Question 3.
Mention any four essential elements of an ideal classification.
Answer:
The following four essential elements should be present in an ideal classification :
- Clarity :
There should be no uncertainty or ambiguity as to the class or group in which the collected data items are to be kept. - Stability :
Stability is necessary to make data comparable and to make meaningful comparisions of the results. - Extensiveness :
The different sections should be composed widely in such a manner that no item of the collected data should be left out. - Suitability :
The composition of the class should be according to the purpose. For example, to find out the economic condition of the persons or the saving trend, it would be appropriate to divide the sections on the basis of income.
Question 4.
What is frequency distribution?
Answer:
Frequency distribution implies the classification of data-items on the basis of some measurable variable. Frequency distribution is a table in which data-items are included in the form of values or classes. The number of units occurring in each value or class are called their frequencies. Thus, the ordered configuration of values or classes and their’ frequencies is palled frequency distribution.
Question 5.
Differentiate between exclusive and inclusive series.
Answer:
Inclusive series :
Those classes in which variable values equal to both their lower and upper limits are included in the class itself are called inclusive classes. In this method, the upper limit is not left out in any class- interval. This series can be identified by the fact that the upper limit of a class and the lower limit of the next class are not the same.
Exclusive series In this series the upper limit of one class and the lower limit of the next class are the same. In this method of tabulation, the variable values equal to the upper limit of a class are not included in that class, rather they are included in the next class.
![]()
Question 6.
How can a normal frequency distribution be converted into cumulative frequency distribution? Clarify with the help of an example.
Answer:
Normal Frequency Distribution
| Class-Interval | Frequency |
| 0-10 | 4 |
| 10-20 | 16 |
| 20-30 | 20 |
| 3040 | 8 |
| 40-50 | 2 |
| Total | N=50 |
Cumulative Frequency Distribution
| Class- Interval | Frequency | Cumulative Frequency |
| 0-10 | 4 | 4 |
| 10-20 | 16 | 20 (16+4) |
| 20-30 | 20 | 40(20+20) |
| 30-40 | 8 | 48 (40+8) |
| 40-50 | 2 | 50 (48+2) |
| Total | N=50 |
Question 7.
Do you agree with the observation that classified data-items are better than unrefined(raw) data-items?
Answer:
Raw data is highly disorganized, due to which it is almost impossible to analyze and to arrive at certain conclusions. Statistical methods cannot be used easily on them. In contrast, classified data become well-ordered, easy to understand and suitable for analysis. Conculsions can be easily drawn from them. Hence, classified data is considered better than raw data.
RBSE Class 11 Economics Chapter 6 Long Answer Type Questions
Question 1.
Explain the inclusive and exclusive methods of classification of data-items.
Answer:
On basis of class-intervals, there are two methods of classification.
Inclusive Method :
Those classes in which variable values equal to both their lower and upper limits are included in the class itself are called inclusive classes. In this method, the upper limit is not left out in any class- interval. The identification of an inclusive classification is that the upper limit of a class and the lower limit of the next class are not equal and there is a maximum difference of 1 between the two consecutive classes.
| Table I | Table II |
| Weight of Children (kg) | X |
| 40-45 | 20-29.5 |
| 46-50 | 30-39.5 |
| 51-55 | 40-49.5 |
| 56-60 | 50-59.5 |
| 61-65 | 60-69.5 |
Exclusive Method :
In this, the upper limit of a class and the lower limit of the next class are the same. This method is called exclusive because the variable values equal to the upper limit of a class are not included in that class, rather they are included in the next class, or the inclusion of variable values equal to the upper limit of a class, is prohibited in that class, or excluded from that class.
Exclusive class- Intervals can be easily understood through the following table:
| Marks | |
| 0-10 | 0 but less than 10 |
| 10-20 | 10 but less than 20 |
| 20-30 | 20 but less than 30 |
| 30-40 | 30 but less than 40 |
| 40-50 | 40 but less than 50 |
![]()
Question 2.
Explain the essential elements in an ideal classification. What are the objectives of classification?
Answer:
Following are the essential elements in an ideal classification :
- Clarity :
There should be no uncertainty or ambiguity as to in which class or group the compiled data should be kept. - Stability :
Stability is necessary to make data comparable and to make out meaningful comparison of the results. - Extensiveness :
The different sections should be composed widely in such a manner that no item of the collected data should be left out. - Suitability :
The composition of the class should be according to the purpose. For example, to find out the economic condition of the persons or the saving trend, it would be appropriate to create classes on the basis of income. - Flexibility :
The classification should be flexible enough to accommodate change, amendment and inclusion in various classes in accordance with new situations. - Homogeneity :
Units of each class should be homogeneous. All the units (data-items) included in a class or group should be present according to the property on basis of which the classification was done.
Objectives of Classification :
- Simplification and conciseness :
The main objective of classfication is to eliminate the complexity of the collected data and to lend them a concise from, so that the classified data can easily be understood. - Clarification of Similarity and Dissimilarity :
By keeping data-items in homogeneous groups having similar properties, separately, the similarity and dissimilarity between them can be easily understood. - Helpful in comparsion :
he comparative study of data-items becomes easy through classification. If the populations of cities or village are categorised in class of literate and illiterate, married and unmarried, employed and unemployed, then both cities/villages can easily be compared on the basis of these attributes. - Logical arrangement :
Classification is a logical process. The data-items included in it are presented in a regular and well-ordered manner. For example – classifying population data-items in classes of age, gender, caste-creed, state, etc. is a logical activity. - Presentation of the basis of tabulation :
Tabulation is impossible without classifying unarranged and raw data, and statistical analysis is also impractical without it. Hence, the process of classification presents a basis for tabulation.
Question 3.
Using an imaginary example, construct discrete and continuous series from the following data-items.
Answer:
The scores of 50 students attending any exam are given below.
| 25 | 30 | 45 | 42 | 52 | 28 |
| 50 | 73 | 60 | 58 | 43 | 30 |
| 76 | 78 | 44 | 63 | 42 | 56 |
| 49 | 44 | 38 | 54 | 67 | 36 |
| 41 | 52 | 65 | 65 | 70 | 46 |
| 37 | 61 | 35 | 40 | 84 | 51 |
| 32 | 50 | 61 | 88 | 54 | 59 |
| 49 | 87 | 35 | 65 | 51 | 59 |
| 50 | 35 |
Changing into continuous series from individual data
| Class-Interval | Tally | Frequency |
| 20-30 | II | 2 |
| 30-40 | IIIIIIIII | 9 |
| 40-50 | IIIIIIIIIII | 11 |
| 50-60 | IIIIIIIIIIIII | 13 |
| 60-70 | IIIIIIII | 8 |
| 70-80 | IIII | 4 |
| 80-90 | III | 3 |
| Total | N=50 |
Following are the marks in the monthly check of 30 students of a class
8, 2, 9, 3, 5, 8, 6, 1, 0, 5, 5, 4, 2, 9, 8, 8, 4, 5, 3, 7, 1, 2, 3, 5, 9, 3, 4, 6, 1, 7
The discrete series will be created as follows
| Obtained Marks | Number of Students (F) |
| 0 | 1 |
| 1 | 2 |
| 2 | 3 |
| 3 | 4 |
| 4 | 3 |
| 5 | 5 |
| 6 | 2 |
| 7 | 3 |
| 8 | 4 |
| 9 | 3 |
| 10 | 0 |
| Total | N = 30 |
RBSE Class 11 Economics Chapter 6 Other Important Questions
RBSE Class 11 Economics Chapter 6 Objective Type Questions
Question 1.
The mid-point of a class-interval is equal to
(a) Average of upper limit and lower limit
(b) Multiple of upper limit and lower limit
(c) Ratio of upper limit and lower limit
(d) None of these
Answer:
(a) Average of upper limit and lower limit
![]()
Question 2.
Statistical calculation in classified data is based
(a) On the actual values of observations.
(b) On the limits of upper class
(c) On the limits of lower class
(d) On the mid-value of class
Answer:
(d) On the mid-value of class
Question 3.
Which of the following tables should be used to divide students into various faculties on the basis of gender (male and female) in a school?
(a) Ordinary Table
(b) Binomial Table
(c) Trinomial Table
(d) Multi-attribute Table
Answer:
(c) Trinomial Table
Question 4.
The mid-value of class limits is called
(a) Class- interval
(b) Magnitude of class
(c) Mid-point
(d) None of these
Answer:
(c) Mid-point
Question 5.
The number of variables included under any class is called
(a) Class-limit
(b) Class Frequency
(c) Class- Interval
(d) None of these
Answer:
(b) Class Frequency
Question 6.
The series in which each value is independent and is written separately is called
(a) Individual series
(b) Discrete series
(c) Continuous series
(d) None of these
Answer:
(a) Individual series
Question 7.
Class-intervals (10-14, 15-19, 20-24, 25-29) are the example of
(a) Exclusive Series
(b) Inclusive Series
(c) Both (a) and (b)
(d) None of these
Answer:
(b) Inclusive Series
![]()
Question 8.
Class-intervals 10-15, 15-20, 20-25, 25-30 are the example of
(a) Inclusive Series
(b) Exclusive Series
(c) Both (a) and (b)
(d) None of these
Answer:
(a) Inclusive Series
Question 9.
Class- magnitude in the series-10-20, 20-30, 30-40, 40-50 is-
(a) 10
(b) 5
(c) 15
(d) None of these
Answer:
(a) 10
Question 10.
Formula of Mid-Value is:
(a) (l1+ l2)/2
(b) (l1– l2)/2
(c) l1 / l2
(d) l1 × l2/2
Answer:
(a) (l1+ l2)/2
RBSE Class 11 Economics Chapter 6 Very Short Answer Type Questions
Question 1.
Write the types of statistical data.
Answer:
- Qualitative/Attributive Data
- Numerical Data
Question 2.
Is it possible to directly measure the qualitative data?
Answer:
No.
Question 3.
What is numeric data?
Answer:
Numeric data are the facts that can be measured directly.
Question 4.
What is a qualitative classification?
Answer:
When facts are classified according to their description or properties (attributes), the process is called Attributive /Qualitative classification.
Question 5.
Write down the two types of qualitative classification.
Answer:
- Ordinary or Binomial classification
- Multi-attribute classification
![]()
Question 6.
What is multi-attribute classification?
Answer:
This classification involves the categorization of facts on the basis of two or more than two properties.
Question 7.
What is class-frequency?
Answer:
The number of data-items occurring within the limits of a certain class, is called the frequency of that class.
Question 8.
What do you mean by mid-value?
Answer:
The middle position between the two limits of a class is called the middle value. Adding the two limits of a class and dividing the sum by 2, gives the mid-point of that class.
Question 9.
How many types of variables are here?
Answer:
Two.
Question 10.
Write the names of variable types.
Answer:
- Discrete variables
- Continuous or indiscrete variables
Question 11.
Into how many parts are statistical series divided on the basis their composition or form?
Answer:
Three
Question 12.
Write the names of the types of statistical series on the basis of their construction.
Answer:
- Individual Series
- Discrete Series
- Continuous or indiscrete Series
Question 13.
What is the objective of classification of data?
Answer:
Statistical data is classified, so that it can be made worthy of analysis.
Question 14.
How many types of classification methods are there according to statistics?
Answer:
Two.
![]()
Question 15.
Which method is commonly used for the discrete variables?
Answer:
Inclusive method is commonly used for the discrete variables.
Question 16.
Which method is used for continuous variables?
Answer:
Exclusive method.
Question 17.
2, 5, 9, 10, 12, 14, 18, 20 is which kind of series?
Answer:
Individual series.
Question 18.
What is meant by inclusive series?
Answer:
Those series in which variable values equal to both their lower and upper limits are included in the class itself, are called inclusive classes. In this method, the upper limit is not left out in any class- interval.
Question 19.
What is classification?
Answer:
Classification is the process of arranging the data facts into homogeneous groups, classes or sub-classes according to their properties and
similarities.
Question 20.
What do you understand by class-interval?
Answer:
The difference between the upper limit and lower limit in any class is called class-interval.
Question 21.
What is meant by statistical series?
Answer:
Statistical series is the data or data-attributes which are arranged in logical sequence.
![]()
Question 22.
What is meant by frequency?
Answer:
The number of times a value occurs in a statistical group, is called the frequency of that value.
Question 23.
What is the purpose of classification of unrefined data?
Answer:
The purpose of classification of unrefined data is to organize it properly so as to make it suitable for statistical analysis.
Question 24.
Write two objectives of classification.
Answer:
- Making it simple and concise
- Clarifying similarity and dissimilarity.
Question 25.
Explain the four important elements of ideal classification.
Answer:
- Clarity
- Stability
- Extensiveness
- Suitability
Question 26.
What type of data are literacy, married status, employment, etc?
Answer:
Literacy, married status, employment are the qualitative data.
Question 27.
What type of data are age, height, weight, income, etc?
Answer:
Age, height, weight, income are the numeric data.
Question 28.
Give one example of binomial classification.
Answer:
Classification of available data on basis of rural and urban or male and female.
![]()
Question 29.
Mention the upper and lower limit in class interval 50-60.
Answer:
50 is lower limit and 60 is upper limit in class interval 50-60.
Question 30.
What is class-interval?
Answer:
The difference between the upper limit and lower limit in any class is called class- interval.
Question 31.
Write down the formula of class-interval.
Answer:
Class interval (i) = Upper limit (l2) – Lower limit (l1)
Question 32.
What does discrete variable mean?
Answer:
Those variables which cannot take all the possible values within a given specified range are termed as discrete variables. They do not have magnitude and their units are indivisible.
Question 33.
Give two examples of discrete variables.
Answer:
- Obtained marks of students in exams 0,1,2,3
- The number of goals made in football.
Question 34.
What is meant by continuous variable?
Answer:
Those variables which can take all the possible values (integer as well as fractional) in a given specified range are termed as continuous variables.
Question 35.
What is the meaning of individual series?
Answer:
Individual Series: When the observations are expressed individually, the value of each and every item can be observed and measured separately, it is known as individual series.
![]()
Question 36.
What is the meaning of discrete series?
Answer:
Discrete Series : The series in which each unit can be factually measured, is called a discrete series.
Question 37.
What is the meaning of continuous or indiscrete series?
Answer:
Indiscrete or continuous series is constructed from continuous variables. Continuous variables have no definite value, instead, they can have any value with a certain limit or class.
Question 38.
Write the two differences between discrete series and continuous series.
Answer:
- The value of units is given in discrete series, while class-intervals are given in continuous series.
- Discreteness exists in discrete series. Unit-value may have a definite difference, while continuity or indiscreteness is found in continuous series.
Question 39.
What is an exclusive series?
Answer:
In this method, the upper limit of a class and the lower limit of the next class are the same. This method is called exclusive because the variable values equal to the upper limit of a class are not included in that class; rather, they are included in the next class.
Question 40.
In any organization, if a class of income is ₹ (400 to 500 rupees) per month, then the workers who get 500 rupees as wages, will be included in which class of exclusive series?
Answer:
These workers are not included in the class (400-500), they will be included in the class (500-600).
![]()
Question 41.
How many types of continuous series are there?
Answer:
Continuous series are of five types. These are the following
- Exclusive Series
- Inclusive Series
- Open-Ended Series
- Cumulative Series
- Series of Mid-Value.
RBSE Class 11 Economics Chapter 6 Short Answer Type Questions
Question 1.
Can the classification of objects be beneficial? Explain by giving an example in your daily life.
Answer:
Classification of objects is very facilitating, and makes it is easy to find objects. If a student classifies his book according to his requirement, he will not have difficulty in finding out the related book when necessary. Student can classify his book on the basis of subject or by the author or by alphabetical order or by the publication year. If student makes a pile of books without the classification, then he will have to check all books for finding a single one.
Question 2.
What are variables? Differentiate between a discrete variable and a continuous variable.
Answer:
Those facts that can be expressed in quantitative terms are called variables, whose value changes continuously. If the height of the students in a classroom is measured, then the height of student will be called a variable.
Difference between discrete and continuous variables :
The difference between these two is that there can be any value of the continuous variable. It gradually increases and it is fractional. For example, 2.4, 3.5 or 0-5, 5-10 etc. class-intervals, whereas the discrete variables are always integers, such as 1, 2, 3, 5, 10, 12, etc.
Question 3.
What are the main benefits of classification?
Answer:
Following are the main benefits of classification
- Data is simplified and abbreviated through classification.
- Classification shows the uniformity of data and increases their usefulness.
- Data becomes comparable through classification.
- Data becomes attractive and impressive by classification.
- The specific difference of data becomes clear by classification.
- Classification provides a scientific basis for data.
![]()
Question 4.
Explain any three essential elements of an ideal classification.
Answer:
Following are the three essential elements of an ideal classification:
- Clarity :
There should be no uncertainty or ambiguity as to which class or group the compiled data should be kept in. - Stability :
Stability is necessary to make statistics comparable and to make meaningful comparisons of the results. - Extensiveness :
The different classes should be composed widely in such a manner that no item of the collected data should be left out.
Question 5.
How many types of statistical data are there?
Answer:
Statistical data are of two types:
- Quantitative/Attributive Data :
Qualitative data cannot be measured directly. They are measured only on the basis of presence and absence of data. Example: literacy, marital status, employment, etc. are qualitative data. - Numeric Data :
Numerical data are those that can be measured directly, such as income, age, height, weight, etc.
Question 6.
What is the meaning of quantitative classification? Explain its classification.
Answer:
When facts are classified according to their description or properties (attributes), the process is called Attributive /Qualitative classification. Qualitative classification are of two types:
- Binomial Classification :
When on the basis of presence and absence of an attribute, the data are classified into two classes- one possessing that attribute, and the other not possessing that attribute, it is called two-fold or Binomial classification. - Multifold Classification :
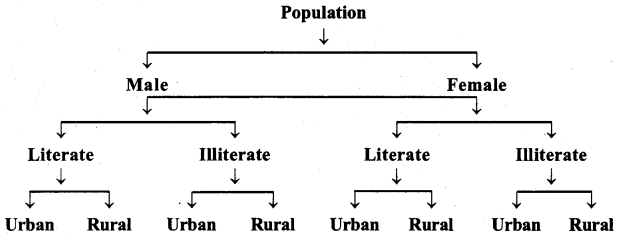
The classification, where two or more attributes are considered while classifying facts and is called a multifold classification. For example, data obtained from census is first divided into male and female classes, and then both are further divided into literate and illiterate, and then further into employed and unemployed.
![]()
Question 7.
Explain the purpose of classifying the compiled data.
Answer:
The purpose of classifying raw data is to organize them sequentially, in which they can easily be made suitable for further statistical analysis. Classification of substances and goods saves precious labour and time, it cannot be done arbitrarily. Thus classification means arranging objects in identical groups or classes.
Question 8.
What does individual series mean? Give one example of individual series.
Answer:
When the observation is expressed individually, and the value of each object can be seen separately, it is known as the individual series. These cannot be divided into classes, nor can they be tabulated frequency-wise. The value that occurs repeatedly, is written as many times separately. These are arranged in ascending or descending order. Generally, the serial numbers, roll numbers, year, names of places or persons are given in such series. Its special identification is that data values are given in it, not their frequencies.
For example – Marks obtained by ten students
17,32,35,33,15,26,41,32,11,8.
Question 9.
What is meant by continuous series? Explain with an example.
Answer:
In a continuous series, data-items are kept in certain definite classes. When kept in classes the data-items lose their individual identity, and individual items merge in one or the other class group. The classes thus created, have continuity, since where one class ends, the next class begins from there. Due to this class continuity, such a series is called a continuous series.
Continuous series is used the most when number of data-items is more and their magnitude is also more.
Example of Continuous Series :
| Age group | Frequency |
| 10-20 | 15 |
| 20-30 | 10 |
| 3040 | 13 |
| 40-50 | 12 |
| 50-60 | 18 |
| 60-70 | 4 |
| 70-80 | 8 |
Question 10.
What is the meaning of discrete series? Give an example.
Answer:
Meaning of Discrete Series :
When the values are largely repeated then we can prepare a series showing different values of the variable along with the number of repetitions of each value. Such a series is called a discrete series. No value is written repeatedly in the discrete series. Each value is written only once. If a price or some value comes repeatedly, then the number of times that value repeated is called the frequency of that value.
| Obtained Marks of Students | Frequency and number of Students |
| 0 | 2 |
| 1 | 4 |
| 2 | 7 |
| 3 | 4 |
| 4 | 3 |
| 5 | 2 |
![]()
Question 11.
What does cumulative frequency series mean? Explain it with an example.
Answer:
Meaning of Cumulative Frequency Series :
Cumulative frequency series refers to a series in which the frequency classes of different classes are not given separately, but the frequency is written in a cumulative form. In such a category, both the boundaries are not provided, only the upper or lower limit is given. When cumulative frequency is given on the basis of the upper limit, the words ‘less than’ is written before each post value and if it is according to the lower limit, the words ‘more than’ is written while writing the cumulative frequency. While solving the question of cumulative frequency series, it is first converted from cumulative to the simple frequency.
Example of Cumulative Frequency Series
| Obtained Marks | Cumulative Frequency |
| Less than 10 | 2 |
| Less than 20 | 12 |
| Less than 30 | 26 |
| Less than 40 | 34 |
| Less than 50 | 40 |
Question 12.
What is the meaning of exclusive series? Give one example of this series.
Answer:
Meaning of Exclusive Series :
The exclusive series is a type of continuous series. In this, the upper limit of the first class is the lower limit of the next class. The value of the upper limit of the first class is not included in that class and is included in the next class, hence it is called an exclusive series.
For example :If the income class is ₹ 100-200 and ₹ 200-300, then the individual with ₹ 200 salary will not be included in the class 100-200, it will be included he the 200-300 class.
Example of Exclusive Series
| Obtained Marks | Cumulative Frequency |
| 0-10 | 5 |
| 10-20 | 7 |
| 20-30 | 15 |
| 30-40 | 3 |
| 40-50 | 5 |
| Total = 35 |
Question 13.
Write the difference between discrete series and continuous series.
Answer:
Following are the differences between discrete series and continuous series:
| Basis | Discrete Series | Continuous Series |
| 1. Form | The value of units is given in discrete series. | Class intervals are given in this series. |
| 2. Measure | Measures are factual in discrete series and are generally in whole numbers. | Measures in continuous series are not factual, rather they are included in artificially made classes. There is no definite value of variables. |
| 3. Discreteness | Discreteness, exists in discrete series. There can be a definite difference in unit values. | Continuity or indiscreteness is found in continuous series. |
| 4. Construction Sources | Discrete series is constructed from discrete variables. | Continuous series is constructed from continuous variables. |
Question 14.
How is inclusive series converted into exclusive series? Explain.
Answer:
Generally, the inclusive method is used for discrete variables (number of workers, obtained marks, etc.). But the exclusive method is used for continuous variables (income, age, weight, etc.) In such a situation, in terms of easy accessibility, we should change the inclusive series to an exclusive category. For this, the difference between the upper limit of one class and the lower limit of the next class is halved and the result is subtracted from the lower limits (l1) of the class and added to the upper limits (l2).
![]()
RBSE Class 11 Economics Chapter 6 Long Answer Type Questions
Question 1.
Give the definition of classification and explain its objectives.
Answer:
Classification is the process of arranging the available facts into homogeneous groups, classes or sub-classes according to resemblances and similarities.
According to Secrist :
“Classification is the process of arranging data into sequences and groups according to their common characteristics, or separating them into different but related parts.”
According to Spur and Smith :
“The process of presenting data by arranging it on the basis of similar properties, in classes or divisions, is called classification.”
In this way, classification is an activity in which data are divided into homogeneous classes, sub-classes, on basis of a property or quality.
Objectives of Classification
Following are the objectives of classification:
i. To make statistical data simple and brief :
The main objective of classification is to eliminate the complexity of collected data-items (figures) and given them a simple and concise form so that they can be understood easily. For example, the salary figures of 1000 workers in the factory were collected. It is not possible to draw any conclusion from them in the same form, but if they are classified, pre-grouped and tabulated, they can be easily understood.
| Wages (In Rs.) | No. of Workers |
| Less than 250 | 40 |
| 250-350 | 300 |
| 350-450 | 320 |
| 450-550 | 180 |
| 550-650 | 100 |
| More than 650 | 60 |
| Total = 1000 |
ii. To clarify similarity and dissimilarity :
By arranging the classified data-items into groups with similar properties and keeping these groups separately, the similarities and dissimilarities between them can be understood easily. Example : Literate, illiterate person. Married-Unmarried person, passed, failed student, etc.
iii. Helpful in Comparison :
One purpose of classification is to make the facts comparable. For example, if the examination results of the intermediate students (commerce) of 2 schools are to be compared, then this can be done with the help of classification:
Inter (Commerce) Exam Results
| Colleges | ||||
| Category | A | B | ||
| Boy Student | Girl Student | Boy Student | Girl Student | |
| Ist | 10 | 2 | 25 | 10 |
| IInd | 50 | 10 | 100 | 25 |
| IIIrd | 10 | 5 | 25 | 5 |
| IVth | 3 | – | 5 | 2 |
| Total | 73 | 17 | 155 | 42 |
iv. Making a logical arrangement :
Classification is a logical process, in which data-items are presented in regular and properly arranged manner. As, dividing population data-items into groups (classes) of age, gender, caste, religion, state, urban/rural, etc. is a logical process.
v. To present the basis for tabulation :
It is impossible to tabulate unorganized and unrefined data-items without classifying them, moreover, without it statistical analysis is impractical. Thus, the process of classification presents a basis for tabulation.
vi. Lending a Scientific basis :
Another objective is to lend statistical data, a scientific basis. This makes data more credible.
vii. Utility :
Classification increases the utility of statistical data by lending them uniformity.
![]()
Question 2.
What are the methods of classification? Explain the important concepts used in classification.
Answer:
The methods of classification are divided into following two main types:
- Qualitative
- Quantitative
1. Qualitative/ Attributive Classification :
In qualitative classification, data is classified on the basis of their attributes and characteristics; like – Male-Female, Literate-Illiterate, Married-Unmarried, etc. Qualitative classification can be of two types-
- Ordinary Classification :
It is also called binomial classification. In this classification, the facts are divided on the basis of presence and absence of an attribute; like- Male-Female, etc. - Multi-attribute Classification :
In this the facts are divided on the basis of more than one attributes. Such classification is shown through the following chart
2. Numeric Classification :
Classification of facts of direct measurement is called numeric classification. Following are the main methods of this classification
- Classification on the basis of time :
When the data is organized on the basis of time, like- hour, day, week, etc. then it is called classification on the basis of time. For example, Five year production of jute in India is presented in the following wayYear 1991 1992 1993 1994 1995 Production of Jute (In millior bales) 200 220 280 300 360
- Geographical Classification :
This is called regional classification or classification according to the location. In this, the data is presented in
accordance with place or location; LikePlace India Japan France America Per capita income (In $) 120 1500 2000 4000
- Variable-value classification :
Facts that are clearly measured in numbers are called variable values. The classification based on this is called variable-value classification. Variable values are of two types – discrete value and indiscrete value. It can be explained by the example given below-On the basis of discrete values On the basis of indiscrete value Daily Income (in₹) No. of Families Income(in₹) No. of Families 10 5 0-100 5 15 7 100-200 7 20 11 200-300 11 25 3 300-400 3 30 2 400-500 2 Total 28 Total 28
Phrases or terminology used in the classification
- Class-Limits :
Each class is made up of two numbers which are called class-limits. The first limit, lower limit or l1 and second limit, upper limit or l2 For example- if the class is 0-20 then 0 is its lower limit(l1) and 20 is its upper limit (l2). If the series is inclusive, like-10-19; 20-29 then first the actual limit is determined, which is 9.5-19.5, 19.5 -29.5. Now the lower limit(l1) in first class is 9.5 and upper limit is 19.5(l2) and the lower limit in second class is 19.5 and upper limit is 29.5. - Class-interval :
The difference between the upper limit and lower limit in any class is called class-interval. Class interval is extracted when the lower limit is subtracted from the upper limit. For example- Given class( 200-100), in this class when we subtract lower limit(100) from upper limit (200) then the class interval is obtained which is 100. - Mid-point :
Mid-point is half of the sum of lower and upper class-limits of a class interval. Formula of the mid-point is given below
Mid-point or Mid-value = (l2 + l2)/2
For example, Mid-point of Class 0 – 10 = (0 + 10)/2 = 5. - Class Frequency :
The number of data-items occurring within the limits of a certain class is called the class frequency of that class. For example:- If 5 terms come in the class 0-5 then these terms are called frequency of the class. Symbol ‘f’ is used to denote the term frequency.
![]()
Question 3.
Explain the characteristics of a good classification.
Answer:
Following are the essential characteristics of a good classification:-
- Clarity :
There should be no uncertainty or ambiguity as to which class or group the collected data is to be kept in. - Stability :
To make the data suitable for comparison and to meaningfully compare the results, it is necessary that the classification has stability. - Extensiveness :
The various classes should be created in such an extensive manner that no data-item from the collected data is left out and is necessarily included in some or the other class. If required, a miscellaneous class can be created; i.e. while creating classes on basis of marital status, widower, widow, divorcee, etc. cannot be included in married and unmarried classes. Hence, classification should be complete and extensive. - Suitability :
Classes should be created in accordance with the objectives. As, in order to know the financial status or saving tendency of people, it would be suitable to create classes on basis of income. - Flexibility :
The classification should be flexible enough to accommodate change, amendment and inclusion in various classes in accordance with new situations. - Homogeneity :
Units of each class should be homogeneous. All the units (data-items) included in a class or group should be present according to the property on basis of which the classification was done.
Question 4.
How many types of statistical series are based on frequency distribution? Explain the different types of statistical series with examples.
Answer:
Statistical series are of three types according to their frequency distribution.
These are :
- Individual Series
- Discrete Series
- Continuous Series
1. Individual Series :
Each unit (data-item) in such type of series is given individual and independence importance. These are divided into classes or groups. Each term is shown distinctly in individual form, they are only arranged in ascending and descending order.
Individual series is shown in the following example
| Serial No. | Obtained Marks in Maths | Serial No. | Obtained Marks in Maths | Serial No. | Obtained Marks in Maths |
| 1 | 17 | 7 | 41 | 13 | 11 |
| 2 | 32 | 8 | 32 | 14 | 15 |
| 3 | 35 | 9 | 11 | 15 | 35 |
| 4 | 33 | 10 | 18 | 16 | 23 |
| 5 | 15 | 11 | 20 | 17 | 38 |
| 6 | 26 | 12 | 22 | 18 | 12 |
For the statistical calculations, the above class will be arranged in ascending or descending order. Normally, the names of places, serial number, enrolment number, etc. are given in such series. Their special identification is that the values are given but their frequency is not given.
2. Discrete Series :
When a value is repeated multiple times, then that value has to be written repeatedly in the individual category. No value is written repeatedly in the discrete series, but the number of times it is repeated is called its frequency and that frequency is written in front of the value. An example of discrete series is given below-
| Marks Obtained by Student | Frequency of Students |
| 0 | 4 |
| 1 | 2 |
| 2 | 6 |
| 3 | 7 |
| 4 | 6 |
| 5 | 5 |
| N = 30 |
From the above example, it is clear that there are 4 students who score ‘0’, there are 2 students who score ‘1’. Similarly, 6 who obtain ‘2’ marks, 7 who obtain ‘3’, ‘6’ who get ‘4’ marks, and 5 students who score ‘5’ marks.
3. Continuous Series :
Terms in the continuous series are placed in defined classes. When placed in classes, term-values lose their true value or personal value. Individual term values merge into one or the other group. Continuation exists in the classes created in this way, because where the 1st class ends, the second class starts from there. Because of this class continuity, this series is called continuous or continuous series.
The use of continuous series is more where the data-values are more and their magnitude is also high. An example of continuous series is given below
| Age Class | Frequency of the persons |
| 10-20 | 15 |
| 20-30 | 10 |
| 30-40 | 13 |
| 40-50 | 12 |
| 50-60 | 18 |
| 60-70 | 4 |
| 70-80 | 8 |
It is clear from the above example that the frequency of class-interval 10-20 is 15. It means that 15 persons are those whose age is in between the 10-20 age class and, 10 people are those whose age in between 20-30. Similarly 13 persons are of 30-40 age class, 12 persons of 40-50 age class, 18 persons of 50-60 age class, 4 persons of 60-70 age class and 8 persons of 70-80 age class.
![]()
Question 5.
Explain the different types of continuous series by example.
Answer:
Types of Continuous Series – Frequency distribution in continuous series is of 5 types:
- Exclusive Series
- Inclusive Series
- Open-Ended Indiscrete Series
- Cumulative Frequency Series
- Series of Mid-Value
1. Exclusive Series:
The exclusive series is a type of continuous category. In this, the upper limit of the first class is the lower limit of the next class. The value of the upper limit of the first class is not included in that class and is included in the next class, hence it is called exclusive series.
For example :
If the income class is 100-200 and 200-300, then the individual with a salary of ₹ 200 will not be included in the class 100-200, it will be included in the 200-300 class.
Example of Exclusive Series
| Obtained Marks | Cumulative Frequency |
| 0-10 | 5 |
| 10-20 | 7 |
| 20-30 | 12 |
| 30-40 | 6 |
| 40-50 | 5 |
In the above series if a student obtains 10 marks, he will be kept in 10-20 class-interval, and student obtaining 40 marks will be included in 40-50 class-interval.
2. Inclusive Series :
In the inclusive series, the intent is from a category in which each class value is included in the same class, which means value of the upper limit (l2) is also included in the same class. In this type of category, upper limit (l2) of first class and lower limit (l1) of next class are not equal. The example of inclusive series is given below-
Inclusive Series
| Marks Obtained by Student | Frequency of Students |
| 1-5 | 2 |
| 6-10 | 3 |
| 11-15 | 7 |
| 16-20 | 4 |
| 21-25 | 4 |
| N = 20 |
The use of inclusive series is appropriate at that time, where there is not a fractional difference between the values but a difference of 1. In the above example, the upper limit of each class is different from the lower limit of the next class. In this series, the value of the upper limit of the class is included in the same class. Therefore, this series is called inclusive series.
3. Open-Ended Indiscrete Series :
Sometimes the lower limit of the first class and the upper limit of the last class series is not written. Such series is called an open-ended series. In such series, instead of the lower limit of the first class, ‘less than’ and instead of the upper limit, last class ‘more than’ is written. In such a situation, the class-interval of the first class and the last class is taken out on the basis of the class interval of the nearest classes. An example of an open-ended series is given below
Open-ended Indiscrete Series
| Marks Obtained by Student | Frequency of Students |
| Less than 5 | 2 |
| 5-10 | 3 |
| 10-15 | 7 |
| 15-20 | 4 |
| More than 20 | 4 |
| N=20 |
In the above example the class-interval of the entire series is 5. Therefore, assuming the extension of the first and the last classes to be is also five, they will be converted to 0 – 5 and 20 – 25.
![]()
4. Cumulative Frequency Series :
Cumulative frequency range refers to a series in which the frequency of different classes is not separated by the category, but the frequencies are written in a cumulative form. In such a category, both the boundaries of each classes are not written. Only upper or lower limits are written. When writing a cumulative frequency based on the upper limit, the word ‘less than’ is written before the term value, and while writing a cumulative frequency based on the lower limit ‘more than’ is written after the term value. While solving question of the cumulative frequency series, it is first converted from cumulative to simple frequency.
The construction of the cumulative series from the ordinary series, and the construction of ordinary series from the cumulative series has been explained by the following example
Ordinary Continuous Series
| Obtained Marks | No, of Students |
| 0-10 | 2 |
| 10-20 | 10 |
| 20-30 | 14 |
| 30-40 | 8 |
| 40-50 | 6 |
| N = 40 |
It can be written in the form of cumulative series as follows:
(A) ‘Less Than’ Cumulative Frequency
| Obtained Marks | No. of Students |
| Less than 10 | 2 |
| Less than 20 | 12 (10 + 2) |
| Less than 30 | 26 (12 +14) |
| Less than 40 | 34 (26 + 8) |
| Less than 50 | 40 (34 + 6) |
| N = 40 |
It can be also written in the following way:
| Obtained Marks | No. of Students |
| Less than 50 | 40 |
| Less than 40 | 34 |
| Less than 30 | 26 |
| Less than 20 | 12 |
| Less than 10 | 2 |
(B) ‘More Than’ Cumulative Frequency
| Obtained Marks | No. of Students |
| More than 0 | 40 |
| More than 10 | 38 |
| More than 20 | 28 |
| More than 30 | 14 |
| More than 40 | 6 |
It can be also written in the following way:
| Obtained Marks | No. of Students |
| More than 40 | 6 |
| More than 30 | 14 |
| More than 20 | 28 |
| More than 10 | 38 |
| More than 0 | 40 |
Converting Cumulative Frequency Series into Ordinary Series :
Cumulative Frequency can be converted into ordinary series. The process of converting this can be clarified by the following example:
Example : Converting the following cumulative frequency series into ordinary series
| Income (In | No. of Students |
| More than 0 | 100 |
| More than 100 | 80 |
| More than 200 | 65 |
| More than 300 | 25 |
| More than 400 | 10 |
Solution :
The lower limit is given in the table above, and it has a difference of 100-100. Therefore, the upper limit of the first year will be 0 +100 = 100. Similarly, the upper limit of all classes will be determined as shown below
| Income | No. of Families |
| 0-100 | 20 (100 – 80) |
| 100-200 | 15 (80 – 65) |
| 200-300 | 40 (65 – 25) |
| 300-400 | 15 (25 – 10) |
| 400-500 | 10 |
| N = 100 |
5. Mid-Value Series- In mid-value series, the mid-values of class-intervals and frequencies are given.
Example-
| Mid-Value | Frequencies |
| 50 | 20 |
| 150 | 15 |
| 250 | 40 |
| 350 | 15 |
| 450 | 10 |
To convert such categories into ordinary category, the classes of the middle values are to be known. Their process is as follows:
First to find out the half of the mid-point difference, where we decrease that half value from mid-point, the lower limit is extracted and when we add this half in mid-point, the upper limit is extracted. In the form of Formula-
Lower Limit
l1 = m-1/2 × i
Upper Limit
l2 = m +1/2 × i
Here m = mid – value, I = class – interval, l1 = lower limit, l2 = upper limit,
![]()
In the above example the difference of mid-value is 100. (150-50 and 250-150 etc) and its half is 50. Deducting 50 from each mid-value, we will get lower limit and adding 50 to each mid-value, we will get the upper limit. The converted series are given below-
| Class | Frequencies | Calculations | |
| 0-100 | 20 | l1 = 50 – 1/2 × 100 = 0 | l2 = 50 + 1/2 × 100 = 100 |
| 100-200 | 15 | l1 = 150 – 1/2 × 100 = 100 | l2 = 150 + 1/2 × 100 = 200 |
| 200-300 | 40 | l1 = 250 – 1/2 × 100 = 200 | l2 = 250 + 1/2 × 100 = 300 |
| 300-400 | 15 | l1 = 350 – 1/2 × 100 = 300 | l2 = 350 + 1/2 × 100 = 400 |
| 400-500 | 10 | l1 = 450 – 1/2 × 100 = 400 | l2 = 450 + 1/2 × 100 = 500 |