RBSE Solutions for Class 6 Maths Chapter 15 Data Handling Ex 15.3 is part of RBSE Solutions for Class 6 Maths. Here we have given Rajasthan Board RBSE Class 6 Maths Chapter 15 Data Handling Exercise 15.3.
| Board | RBSE |
| Textbook | SIERT, Rajasthan |
| Class | Class 6 |
| Subject | Maths |
| Chapter | Chapter 15 |
| Chapter Name | Data Handling |
| Exercise | Ex 15.3 |
| Number of Questions | 6 |
| Category | RBSE Solutions |
Rajasthan Board RBSE Class 6 Maths Chapter 15 Data Handling Ex 15.3
Question 1.
The bar graph given below shows the number of (RBSESolutions.com) student awarded scholarship during the years 2012 – 2015, in a particular school. Read the bar graph and write down your observations.
(i) What is the scale of this bar graph?
(ii) How many students were awarded Scholarships in the year 2014?
(iii) In which year, minimum number of Scholarships were awarded?
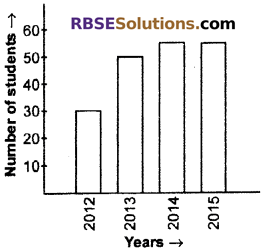
Solution:
(i) Scale = 1 cm = 10 Students
(ii) 60 students were awarded scholarships in the year 2014.
(iii) In 2012, minimum number of Scholarships were awarded.
![]()
Question 2.
Given below is the data (RBSESolutions.com) regarding average ages of some animals.
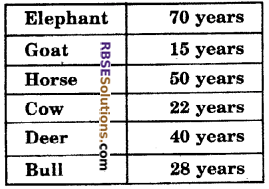
Draw a bar graph to represent the above information and answer the following questions.
(i) Name the animal with highest average age.
(ii) Name the animal with least average age.
(iii) Find the difference between average ages of bull and cow.
Solution:
(i) Elephant the animal (RBSESolutions.com) with highest average age.
(ii) Goat the animal with least average age.
(iii) The difference between average ages of bull and cow = 22 ∼ 28 = 6
Question 3.
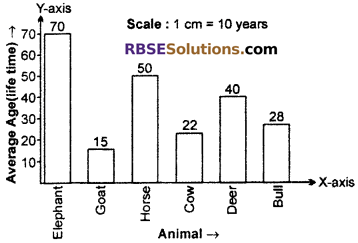
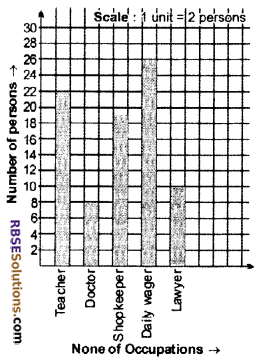
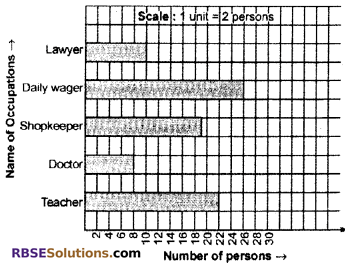
Number of persons in various occupations in (RBSESolutions.com) a colony is given in the following table.
To represent the above information choose a scale of your choice and draw
(i) a vertical bar graph
(ii) a horizontal bar graph
Solution:
(i) A vertical (RBSESolutions.com) bar graph
(ii) a horizontal (RBSESolutions.com) bar graph
Question 4.
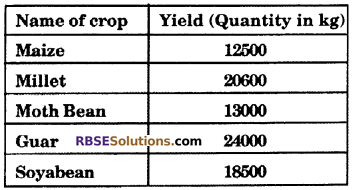
Following table show the yield of (RBSESolutions.com) various crops in Harku’s from this year.
Take a scale of your choice and draw a horizontal bar graph to represent the above information and answer the following questions.
(i) Which crop has maximum (RBSESolutions.com) yield and how much quantity?
(ii) What is the total yield?
(iii) Which crop yielded 20600 kg?
Solution:
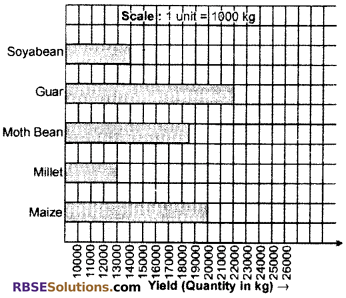
(i) Guar has maximum yield (24000 kg).
(ii) Total yield = 12500 + 20600 + 13000 + 24000 + 18500 = 88600 kg
(iii) Millet yielded 20600 kg.
![]()
Question 5.
Following table shows the number of (RBSESolutions.com) students who participated in various competitions in a camp.
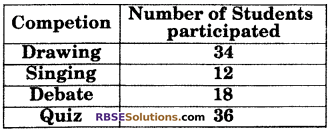
Take a scale of your choice and draw a horizontal bar graph and a vertical bar graph to represent the above information.
Solution:
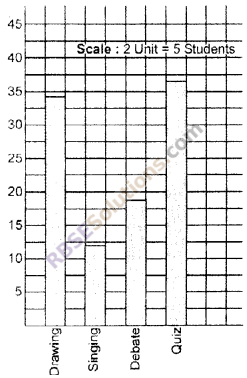
A vertical bar graph :
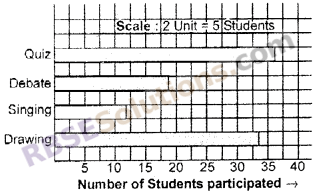
A horizontal (RBSESolutions.com) bar graph :
Question 6.
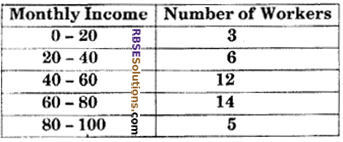
The following table shows marks obtained by 40 students (RBSESolutions.com) in a Mathematics quiz competition
Answer the following questions :
(i) Number of students who obtained marks in the groups 40 – 60.
(ii) This marks group having maximum number of students ?
(iii) Number of students who obtained more than 60 marks.
Solution:
(i) 12 students obtained (RBSESolutions.com) marks in the group 40 – 60.
(ii) 60 – 80 marks group have maximum number (14) of students.
(iii) Number of students obtained more than 60 marks = 14 + 5 = 19.
![]()
We hope the RBSE Solutions for Class 6 Maths Chapter 15 Data Handling Ex 15.3 will help you. If you have any query regarding Rajasthan Board RBSE Class 6 Maths Chapter 15 Data Handling Exercise 15.3, drop a comment below and we will get back to you at the earliest.