RBSE Solutions for Class 7 Maths Chapter 17 Data Handling Ex 17.1 is part of RBSE Solutions for Class 7 Maths. Here we have given Rajasthan Board RBSE Class 7 Maths Chapter 17 Data Handling Exercise 17.1.
| Board | RBSE |
| Textbook | SIERT, Rajasthan |
| Class | Class 7 |
| Subject | Maths |
| Chapter | Chapter 17 |
| Chapter Name | Data Handling |
| Exercise | Ex 17.1 |
| Number of Questions | 3 |
| Category | RBSE Solutions |
Rajasthan Board RBSE Class 7 Maths Chapter 17 Data Handling Ex 17.1
Question 1
In the following graph, number of students of a school are shown below (RBSESolutions.com) according to session. Answer the questions on the basis of this graph.
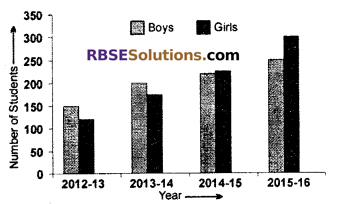
(i) In which session, number of girls were (RBSESolutions.com) more than number of boys in the school?
(ii) In which session, number of both girls and boys in the school were equal?
(iii) What was the total number of students in the school in the session 2015 – 16.
Solution:
(i) As per the given graph in session 2015 – 16 the number of girls are more than the number of boys students.
(ii) In the session 2014 – 15 the number of boys and girls students are equal.
(iii) In session 2015 – 16 the total number of students.
= Boys students + Girls students
= 250 + 300
= 550.
![]()
Question 2
Under the free textbook distribution scheme (RBSESolutions.com) from the year 2011 to 2015, the distribution of books of the subjects Mathematics and Hindi of class 7 in a district were as follows:
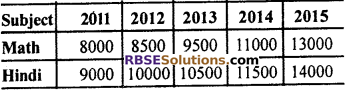
Draw the double bar graph and answer the following question.
(i) The demand of book of which subject is maximum always?
(ii) In which year the difference in the demand of both the books is minimum?
(iii) In which year the difference in the (RBSESolutions.com) demand of both the book is maximum?
Solution:
Double bar graph
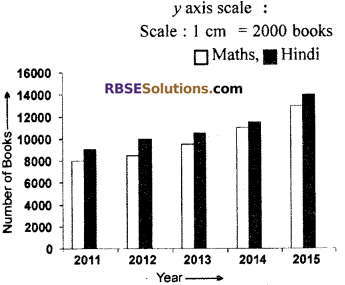
(i) Hindi books is in more demand always.
(ii) According to graph in year 2014 Maths and Hindi books (RBSESolutions.com) difference = 11500 -1100 = 500 which is minimum.
(iii) In year 2012 the difference in Math and Hindi books = 10000 – 8500 = 1500 which is maximum.
Question 3
Estimated distance of following cities of Rajasthan from Udaipur by road and by train are given in the following table. Draw a double bar graph on the basis of table and answer the following questions :
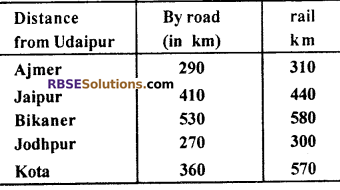
(i) Which city is at (RBSESolutions.com) a maximum distance from Udaipur by road?
(ii) Which city has least difference in the distance by road and by train?
(iii) Which city has highest difference in the distance by road and by train?
Solution:
Double bar graph ![]() by road
by road ![]() by rail
by rail
Scale : y-axis, 1 cm = 100
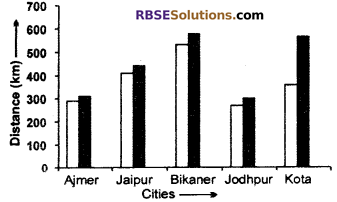
(i) According to graph the distance of Udaipur and Bikaner is 530 km which is maximum.
(ii) The difference (RBSESolutions.com) of distance between Ajmer and Udaipur by road and rail transport is minimum which is 310 – 290 = 20 km.
(iii) To move Kota the distance is maximum between road and rail = 570 – 360 = 210 km.
![]()
We hope the RBSE Solutions for Class 7 Maths Chapter 17 Data Handling Ex 17.1 will help you. If you have any query regarding Rajasthan Board RBSE Class 7 Maths Chapter 17 Data Handling Exercise 17.1, drop a comment below and we will get back to you at the earliest.