RBSE Solutions for Class 8 Maths Chapter 16 Data Handling Additional Questions is part of RBSE Solutions for Class 8 Maths. Here we have given Rajasthan Board RBSE Class 8 Maths Chapter 16 Data Handling Additional Questions.
| Board | RBSE |
| Textbook | SIERT, Rajasthan |
| Class | Class 8 |
| Subject | Maths |
| Chapter | Chapter 16 |
| Chapter Name | Data Handling |
| Exercise | Additional Questions |
| Number of Questions | 52 |
| Category | RBSE Solutions |
Rajasthan Board RBSE Class 8 Maths Chapter 16 Data Handling Additional Questions
I. Objective Type Questions
Question 1.
Why it is necessary to collect the data in systematic form?
(a) for beautification
(b) for tabulation
(c) for meaningful results
(d) None of the above.
Question 2.
Which of the following tally bars is representing number 5?
![]()
Question 3.
The angle at the centre of a circle is
(a) 90°
(b) 360°
(c) 180°
(d) 100°
![]()
Question 4.
The probability of getting 2 on a dice, when it is thrown?
(a) \(\frac { 2 }{ 6 }\)
(b) \(\frac { 1 }{ 6 }\)
(c) \(\frac { 1 }{ 3 }\)
(d) \(\frac { 6 }{ 6 }\)
Question 5.
The length of class interval of 0-10, 10-20, 20-30……..is
(a) 30
(b) 10
(c) 20
(d) 0
Question 6.
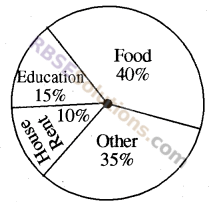
After observing the given pie-chart, give the answer that in which item the expenditure is maximum?
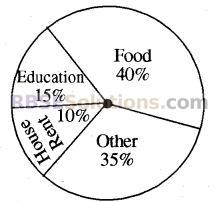
(a) On Food
(b) On House Rent
(c) On Education
(d) On others
![]()
Question 7.
The heights of rectangles in a histogram is
(a) inversely proportional to frequency
(b) directly proportional to frequency
(c) directly proportional to class-interval
(d) inversely proportional to class interval
Question 8.
The total outcomes of tossing a coin are
(a) 1
(b) 2
(c) 0
(d) – 1
Question 9.
Probability of getting a even number when a dice is thrown, is
(a) \(\frac { 1 }{ 2 }\)
(b) 1
(c) \(\frac { 1 }{ 3 }\)
(d) 1
Answers
1. (c)
2. (d)
3. (b)
4. (b)
5. (b)
6. (a)
7. (b)
8. (b)
9. (a).
![]()
II. Fill in the blanks
Question 1.
We have maximum data in unsystematic form. These are called___
Question 2.
A___shows the relation between whole and the parts.
Question 3.
___are those in which results may not be predicted.
Question 4.
Probability of any event
= Number of events which make event
______________________________
Question 5.
The width of each rectangle in a histogram is___
Answers
1. data
2. Pie-chart
3. Random experiments
4. No. of total results
5. equal.
![]()
III. True/False Type Questions
Question 1.
Bars are at equal distance in a histogram.
Question 2.
The difference between upper limit and lower limit is called range.
Question 3.
The meaning of organizing the data in systematic way is to arrange them in ascending or descending order.
Question 4.
Frequency is which shows that a particular entry is repeated how many times in the data
Question 5.
The class interval, which has minimum(RBSESolutions.com)frequency is called mode class interval.
Answers
1. True
2. True
3. True
4. True
5. False.
![]()
IV. Matching Type Questions
| Part 1 | Part 2 |
| 1. Frequency of class 3-5 in distribution 4, 8, 3, 6, 7, 2, 3, 5, 9, 4, 6, 5, 5 | (a) 5 |
| 2. Range of class-interval 5-10 | (b) 0 |
| 3. Probability of getting 8, when a dice is thrown | (c) \(\frac { 1 }{ 2 }\) |
| 4. Probability of getting one black card from a pack of 52 cards | (d) 4 |
Answers
1. ↔ (d),
2. ↔ (a),
3. ↔ (b),
4. ↔ (c)
![]()
V. Very Short Answer Type Questions
Question 1.
Write two properties of a histogram.
Answer
- Class intervals are shown on horizontal line.
- Length of bars shows frequency of class intervals.
Question 2.
Write the lower and upper limit of class 10-20.
Answer
Lower limit = 10, upper limit = 20
Question 3.
What is the width(RBSESolutions.com)or size of a class interval?
Answer
Difference of upper limit and lower limit.
Question 4.
What do you understand by frequency?
Answer
The number of times an observation occurs in the given data is called the frequency of the observation.
![]()
Question 5.
Draw a pie-chart of following data
| Taste | Chocolate | Vanila | Other |
| Percentage of students who like the taste | 50% | 25% | 25% |
Answer
Question 6.
There are 4 red balls and 2 yellow balls in a bag. What is the probability of drawing out one red ball?
Solution
Total number of outcomes
= 4 + 2 = 6
Number of favourable outcomes = 4
Probability of getting red ball .
\(=\frac { 4 }{ 6 } =\frac { 2 }{ 3 } \)
Question 7.
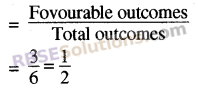
Find the probability of getting on even number when a dice is thrown.
Solution
When a dice is(RBSESolutions.com)thrown, the total outcomes are = 6 (1, 2, 3, 4, 5, 6)
Even numbers = 2, 4, 6
i.e. 3 even numbers
∴Required Probability
![]()
VI. Short Answer Type Questions
Question 1.
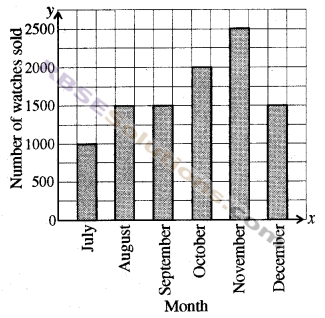
Draw a proper graph of given information
| Month | Number of sold watches |
| July | 1000 |
| August | 1500 |
| September | 1500 |
| October | 2000 |
| November | 2500 |
| December | 1500 |
Solution
![]()
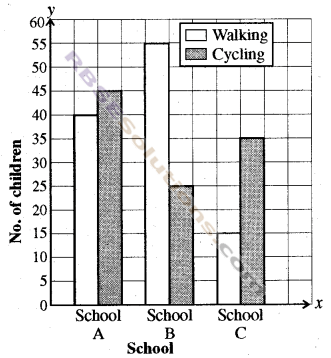
Question 2.
Draw a proper graph for given information.
| Children like | School A | School B | School C |
| Walking | 40 | 55 | 15 |
| Cycling | 45 | 25 | 35 |
Solution
![]()
Question 3.
Observe the given histogram and answer the following questions
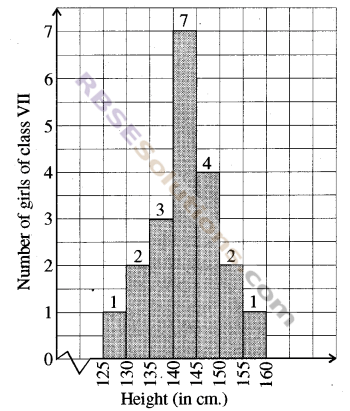
(i) Which information is being given by histogram?
(ii) In which class the number of girls is maximum?
(iii) How many students are having 145 cm. or more height?
(iv) If we divide(RBSESolutions.com)the girls in three categories, then how many girls will be there in each category?
150 cm. or more — Class A
between 140 cm to 150 cm — Class B
less than 140 cm. — Class C
Solution
(i) Height of the students (girls) of class VII.
(ii) In 140-145 class-interval.
(iii) 4 + 2 + 1 = 7
(iv) In class A, 2 + 1 = 3 girls
In class B, 7 + 4 = 11 girls
In class C, 1 + 2 + 3 = 6 girls
![]()
Question 4.
Write answer of the following questions according to the number of books given in the bar graph
(1) Which subject has(RBSESolutions.com)maximum books and how much?
(2) Out of books of math’s and science which subject has less books and how many?
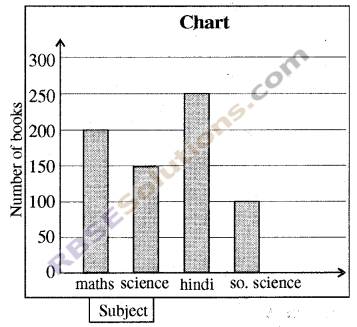
Solution :
(1) Hindi has maximum no. 8 books. The number of Hindi books = 250
(2) Number of Maths books = 200 Number of Science books = 150
Clearly Science books are(RBSESolutions.com)less than maths books and 200 – 150 = 50.
![]()
Question 5.
A survey was conducted to know the liking of music type on the youth of a city. A pie-chart is representing the data of survey answer the following questions by observing the pie-chart.
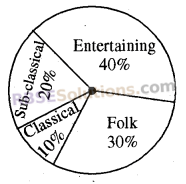
(i) In 20 people like classical music, then how many people did participate in survey?
(ii) Which type of music were liked by maximum people?
(iii) If a cassette(RBSESolutions.com)company make 1000 C.D.’s, then write the number of C.D.’s of each category.
Solution
(i) Let x persons participated in survey. Then,
10% of x = 20
\(x\times \frac { 10 }{ 100 } =20\)
\(x=\frac { 20\times 100 }{ 10 } \)
x = 200
(ii) Entertaining Music
(iii) No of CD’s
Classic Music = \(\frac { 10 }{ 100 }\times 1000=100\)
Sub Classic Music = \(\frac { 20 }{ 100 }\times 1000=200\)
Folk Music = \(\frac { 30 }{ 100 }\times 1000=300\)
Entertaining(RBSESolutions.com)Music = \(\frac { 40 }{ 100 }\times 1000=400\)
![]()
Question 6.
Accidents occurring by driver’s negligence’s are shown in the given pie- chart Using pie-chart give answers of the following questions.
(1) What is the(RBSESolutions.com)cause of maximum accidents?
(2) How many accidents occurred by violating traffic rules.
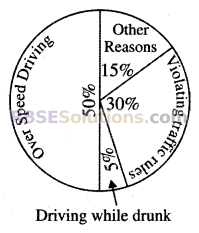
Solution :
(1) The cause of maximum accidents is over speed driving.
(2) Total 30% accidents occurred by violating traffic rules.
![]()
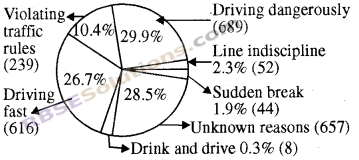
Question 7.
Accidents occurring in a city in a month due to various reasons are shown in the given pie-chart
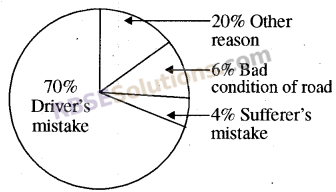
(i) What is the total percentage of accidents due to sufferer’s mistake and bad conditions of roads?
(ii) What is the cause of maximum accidents?
Solution
(i) Total percentage of accidents due to sufferer’s mistake and bad condition of road is = 6% + 4% = 10%
(ii) Maximum accidents(RBSESolutions.com)occurred due to driver’s mistake and it is 70%.
![]()
Question 8.
Accidents occurring by driver’s negligence and walker’s mistake are shown in the given pie-chart Find the part of circle in degree (°) for each information
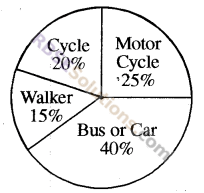
Solution
∵ 100% = 360°
∴1% = \(\frac { 360 }{ 100 }\) = 3.60°
(i) Part of circle due to walker’s mistake = 15 x 3.60° = 54°
(ii) Part of circle due to cycle rider’s mistake = 20 x 3.60° = 72°
(iii) Part of circle due(RBSESolutions.com)to motor cycle rider’s mistake = 25 x 3.60° = 90°
(iv) Part of circle due to car of bus driver’s mistake = 40 x 3.60° = 144°
![]()
Question 9.
Find the corresponding angles related to various mistakes in the given pie chart
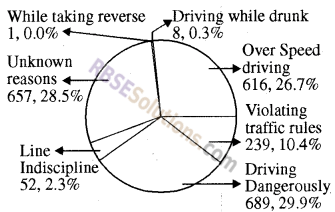
(1) Over speed driving.
(2) Violating traffic rules
Solution
(1) Over speed driving people = 26.7%
∵ 100% = 360°
∴ 1% = \(\frac { 360 }{ 100 }\) = 3.60°
Angle related to over speed driving
= 26.7 x 3.6 = 96.12°
(2) Violating traffic rules people = 10.4%
Related angle = 26.7 x 3.6 = 96.12°
![]()
Question 10.
Various mistake of automobiles drivers are shown in the given pie chart Using this pie-chart give the answers of the following questions
(i) Percentage of accidents by line indiscipline?
(ii) What is the cause of maximum accidents?
Solution
(i) Percentage of accidents by line indiscipline is 2.3%
(ii) Driving(RBSESolutions.com)dangerously is the cause of maximum accidents.
![]()
Question 11.
Various mistakes of automobile drivers in Jaipur city are shown in the given pie-chart. Give the answer of the given questions
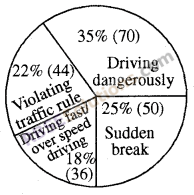
(1) What is the percentage of accidents by over speed driving?
(2) What is the percentage of accidents by violating traffic rules?
Solution
(1) Percentage of accidents by over speed driving is 18%.
(2) Percentage of accidents by violating traffic rules is 22%.
![]()
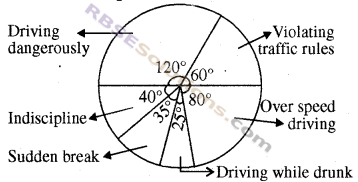
Question 12.
Accidents occurring by driver’s negligence are shown in the given pie-chart Using pie-chart give answers of the following questions
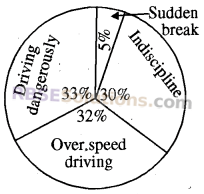
(1) If the total number of accidents occurred 300 them what is the number of accidents due to driving dangerously?
(2) What is the cause of minimum accidents?
Solution
(1) If the total number of accidents is 300 than the number of accidents due to driving dangerously is
= \(\frac { 33 }{ 100 }\) x 300 = 99
(2) Sudden break is the cause of minimum accidents which is \(\frac { 5 }{ 100 }\) x 300 = 15
![]()
Question 13.
Various automobile drivers in last five years in Jaipur city are shown in pie chart If the total number of accidents is 900 then give the answers of the(RBSESolutions.com)following questions
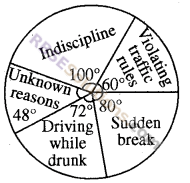
(1) What is the cause of 250 accidents?
(2) What is the cause of minimum accidents?
Solution
Total accidents = 900
(1) Accidents due to indiscipline
= \(\frac { 100 }{ 360 }\) x 900 = 250
(2) The cause of minimum accidents is unknown reasons.
![]()
Question 14.
There are total 3600 accidents occurred in the January 2017 in Rajasthan. It is shown in pie-chart given below. Give die answers of given questions
(1) What is the cause of maximum accidents?
(2) How many(RBSESolutions.com)accidents were occurred due to indiscipline?
Solution
(1) The cause of maximum accidents in driving dangerously as it has greatest angle in circle.
(2) Accidents occurred due to indiscipline
= \(\frac { 40 }{ 360 }\) x 3600 = 400
![]()
Question 15.
Various mistakes of automobile drivers are shown in the following pie-chart With the help of pie-chart answer the following questions :
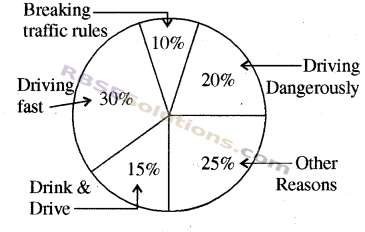
(i) Percentage of accidents due to disobedience of traffic rules?
(ii) Percentage of accidents due to driving dangerously?
(iii) Due to which(RBSESolutions.com)mistake of automobile driver maximum accidents take place?
(iv) Due to which mistake of automobile driver minimum accidents take place?
Solution
(i) 10% accidents occurred due to disobedience of traffic rules.
(ii) 20% accidents occurred due to driving dangerously.
(iii) Due to driving fast by automobile driver, maximum accidents took place.
(iv) Minimum accidents(RBSESolutions.com)took place due to breaking traffic rules by drivers.
![]()
Question 16.
Following pie-chart represents percentage of penalties on various mistakes of automobile drivers.
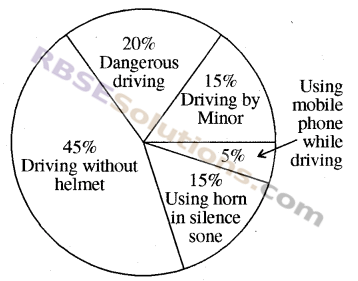
With the help of pie-chart answer the following questions
(i) Write total percentage of penalties on dangerous driving and driving without helmet.
(ii) Write difference of percentage of penalties on driving by minor and using mobile phone while driving.
Solution
(i) Percentage of penalties on dangerous driving = 20%
Percentage of penalties on driving without helmet = 45%
∴The total percentage(RBSESolutions.com)of penalties on both the aforesaid mistakes = 20% + 45% = 65%
(ii) Percentage of penalties on driving by minor = 15%
Percentage of penalties on using mobile phone while driving = 5%
The required difference = 15% – 5% = 10%
![]()
Question 17.
Given bar graph shows the expenditure on different items under ‘Swachata Abhiyan’ in any city.
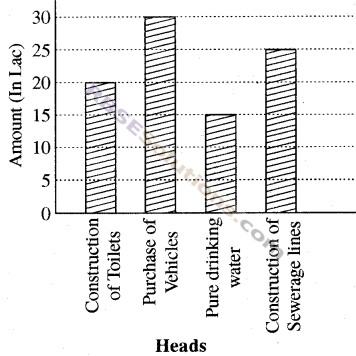
Answer the following questions by observing the graph
(1) On which items, maximum(RBSESolutions.com)amount is expended and how much?
(2) How much amount was spent in construction of toilets.
Solution
(1) Maximum expenditure of Rs 30 lacs is in purchase of vehicles.
(2) Expenditure in construction of toilets = Rs 20 lacs.
![]()
Question 18.
The following pie-chart shows the various mistakes of automobile drivers.
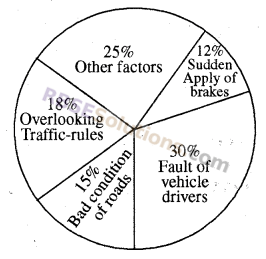
On the basis of pie-chart, answer the following questions :
(i) Due to which mistake, maximum accident took place?
(ii) How many accidents(RBSESolutions.com)occur due to sudden apply of brakes and bad condition of road collectively?
Solution
(i) Mistake of automobile driver,
(ii) Sudden Braking = 12%
and bad condition of roads = 15%
Total percentage of accidents = (12 + 15)%
= 27%
![]()
We hope the given RBSE Solutions for Class 8 Maths Chapter 16 Data Handling Additional Questions will help you. If you have any query regarding Rajasthan Board RBSE Class 8 Maths Chapter 16 Data Handling Additional Questions, drop a comment below and we will get back to you at the earliest.