RBSE Solutions for Class 8 Maths Chapter 16 Data Handling Ex 16.1 is part of RBSE Solutions for Class 8 Maths. Here we have given Rajasthan Board RBSE Class 8 Maths Chapter 16 Data Handling Exercise 16.1.
| Board | RBSE |
| Textbook | SIERT, Rajasthan |
| Class | Class 8 |
| Subject | Maths |
| Chapter | Chapter 16 |
| Chapter Name | Data Handling |
| Exercise | Exercise 16.1 |
| Number of Questions | 5 |
| Category | RBSE Solutions |
Rajasthan Board RBSE Class 8 Maths Chapter 16 Data Handling Ex 16.1
Question 1.
To show which type of data you will need a histogram?
(i) Quantity of different types of cereals available at home.
(ii) Height of all students of your school.
(iii) Number of cars(RBSESolutions.com)manufacture by, 5 companies.
(iv) Number of vehicles passing a busy cross road between 8:00 A.M. to 2:00 P.M.
(v) Distance between home to school of all students of your class, (in metres)
Solution:
We use histogram to show the data of (ii), (iv) and (v).
Question 2.
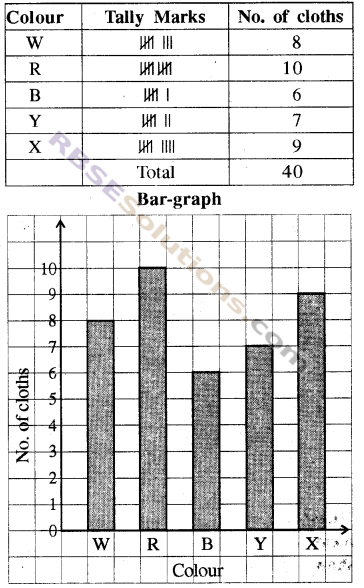
Rakesh distinguishes his clothes on basis of colors and indicate like this—White (W), Red (R), Black (B), Yellow (Y), and Others (X). List formed is as follows
R R X W R B Y R B W W X X R B Y Y X W R B Y Y B R R X W W R W X X R Y W B Y X X
Using tally marks form a frequency distribution table. To represent it use a bar graph.
Solution:
Frequency Distribution Table
![]()
Question 3.
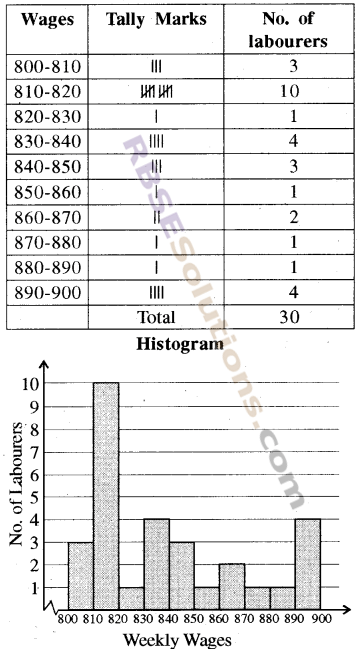
Payment of the Wage for a week in rupees to 30 NREGA workers of Khatwara village
830, 835, 890, 810, 815, 816, 814, 845, 898, 890, 819, 860, 832, 817, 855, 845, 804, 808, 812, 816, 885, 835, 815, 812, 878, 840, 868, 890, 806, 828
Prepare a frequency distribution(RBSESolutions.com)table having class interval as 800-810, 810-820 using tally marks. Draw a histogram using table.
Solution
Frequency Distribution Table
![]()
Question 4.
Number of mobiles sold in 30 days by Ms. Raja Electronics
222, 228, 238, 215, 225, 219, 217, 230, 218, 237, 214, 210, 235, 222, 220, 214, 212, 220, 237, 212, 238, 218, 210, 216, 217, 234, 233, 237, 219, 239
Prepare a frequency distribution table having class interval as 210-215, 215-220 using tally marks. Draw a histogram using table and answer the following questions.
(i) Number of(RBSESolutions.com)mobiles sold in which class interval are maximum?
(ii) How many days 230 or more mobiles were sold?
(iii) On how many days less than 230 or mobiles were sold?
Solution
Frequency Distribution Table
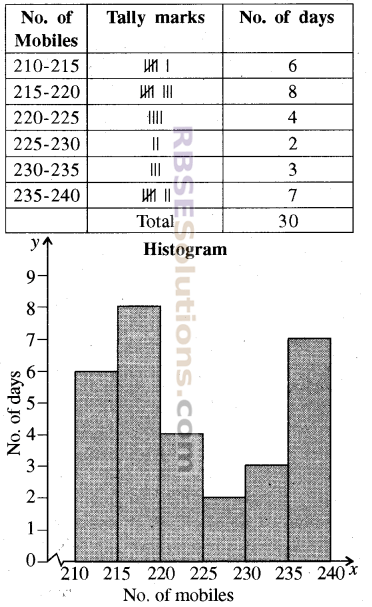
(i) The class interval 215-220 has the maximum frequency.
(ii) In 3 + 7 = 10 days, 230 or more(RBSESolutions.com)mobiles are sold.
(iii) In 6 + 8 + 4 + 2 = 20 days, less than 230 mobiles are sold.
![]()
Question 5.
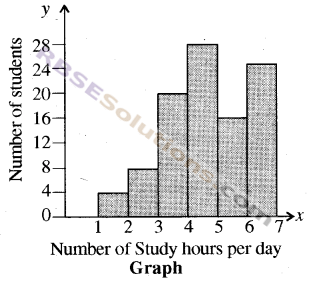
In holidays number of study hours every day of students of class 8 is shown in the graph
Answer the following questions—
(i) How many hours did most of students studied?
(ii) How many(RBSESolutions.com)students studied for 5 or less than 5 hours?
(iii) How many students studied in vacations?
(iv) Frequency of which class interval is maximum?
Solution
(i) Maximum students studied for 4-5 hours.
(ii) Number of students who studied for 5 or less than 5 hours = 4 + 8 + 20 + 28 = 60.
(iii) Number of students who(RBSESolutions.com)studied during the holidays = 4 + 8 + 20 + 28 + 16 + 24 = 100.
(iv) Class interval 4-5 has the maximum frequency.
![]()
We hope the given RBSE Solutions for Class 8 Maths Chapter 16 Data Handling Ex 16.1 will help you. If you have any query regarding Rajasthan Board RBSE Class 8 Maths Chapter 16 Data Handling Exercise 16.1, drop a comment below and we will get back to you at the earliest.