RBSE Solutions for Class 8 Maths Chapter 16 Data Handling In Text Exercise is part of RBSE Solutions for Class 8 Maths. Here we have given Rajasthan Board RBSE Class 8 Maths Chapter 16 Data Handling In Text Exercise.
| Board | RBSE |
| Textbook | SIERT, Rajasthan |
| Class | Class 8 |
| Subject | Maths |
| Chapter | Chapter 16 |
| Chapter Name | Data Handling |
| Exercise | In Text Exercise |
| Number of Questions | 12 |
| Category | RBSE Solutions |
Rajasthan Board RBSE Class 8 Maths Chapter 16 Data Handling In Text Exercise
Page No: 193
Question 1.
From given bar graph answer the following questions by looking at number of books on different-different subjects in library
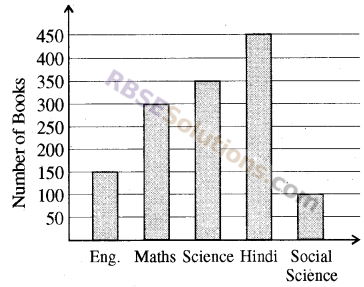
Width of Bars are same and equal distances are kept between two consecutive bars.
Here, Length of bar represents- number of corresponding data
(i) Which subject has maximum number of books and how many?
(ii) Which subject has least number of books and how many?
(iii) How many(RBSESolutions.com)books are there in the library?
(iv) What information has been given by this bar graph?
(v) Difference in the number of books of which two subjects is minimum?
Solution:
(i) Hindi, 450
(ii) Social Science, 100
(iii) Total books = 150 + 300 + 350 + 450 + 100 = 1350
(iv) This bar graph represents the number of books of each subject in the library.
(v) Subjects Maths and Science (350 – 300 = 50) and English and Social Science (150 – 100 = 50) have the minimum difference of books.
Page No: 193-194
![]()
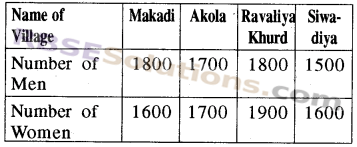
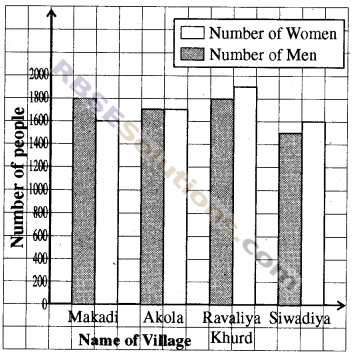
Question 2.
A double bar graph is given on marks obtained by 5 students in yearly and half yearly exam in mathematics subject.
Answer the following questions on basis of graph
(i) Whose performance was similar in annual and half yearly examination?
(ii) Whose performance was better in annual as compared to half yearly?
(iii) How many students(RBSESolutions.com)scored more than 50 in annual examination?
(iv) Which information is given in this double bar graph?
(v) What is the average of marks of half yearly? Is that less than average of annual examination?
Solution
(i) Vibha
(ii) Chayan
(iii) 3 students
(iv) The double bar graph gives the marks of 5 students obtained in Mathematics in half-yearly and yearly exam.
(v) Average of marks in half-yearly exam.
= \(\frac { 50+40+60+40+80 }{ 5 }\)
= \(\frac { 270 }{ 5 }\)
= 54
Average of marks in yearly exam..
= \(\frac { 55+40+85+50+70 }{ 5 }\)
= \(\frac { 300 }{ 5 }\)
= 60
Yes, average marks obtained in half-yearly exam is less than yearly exam.
Page No: 194
![]()
Draw different graphs to show given information
Question 3.
(i)
Solution
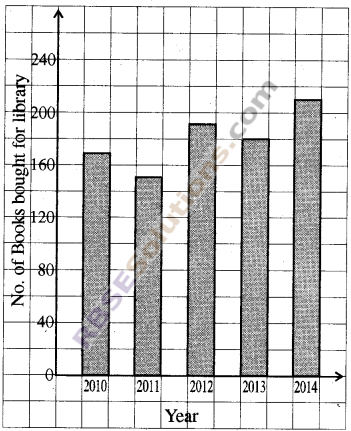
(ii)
Solution
Page No: 197
![]()
Question 4.
Study the following frequency distribution table given below and answer the following questions
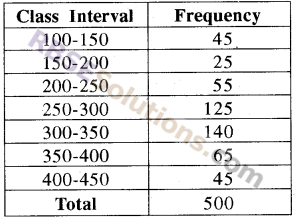
(i) What is measure of class interval?
(ii) Which is upper limit of class interval 300-350?
(iii) Frequency(RBSESolutions.com)of which group is maximum?
(iv) Frequency of which two groups is same?
Solution
(i) Class size = 150 – 100 = 50
(ii) 350
(iii) 300-350
(iv) 100-150 and 400-450
Question 5.
Marks obtained by 40 students in science out of 50 marks is as follows
38, 35, 44, 30, 30, 33, 38, 40, 35, 45, 48,
40, 35, 45, 38, 35, 44, 33, 40, 42, 45, 38,
35, 33, 34, 37, 47, 49, 37, 47, 40, 31, 38,
43, 31, 37, 41, 38, 45, 40
(i) Make a frequency distribution table of given data taking interval 30-35, 35-40 etc
(ii) What are the(RBSESolutions.com)class limits of class interval 35-40?
(iii) What is class measure of, class interval?
Solution
(i) Frequency Table
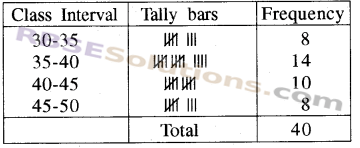
(ii) Upper limit of 35 – 40 = 40 and lower limit – 35
(iii) Class size = 35 – 30 = 5
Page No: 198
![]()
Question 6.
Given below is a histogram between number of families and their expenditure (graph 16.5). From this histogram 16.5 we can tell
(i) How many families have minimum expenditure?
(ii) How many(RBSESolutions.com)families have maximum expenditure?
(iii) How many families have their expenditure less than Rs. 4000?
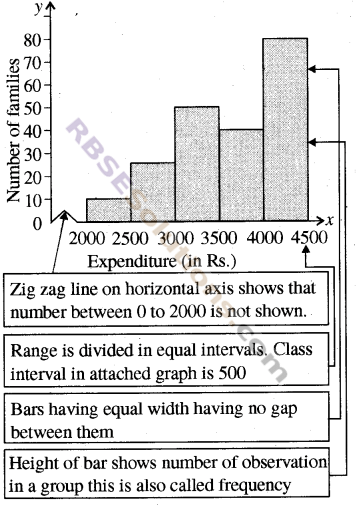
Solution
(i) 10 families.
(ii) 80 families.
(iii) 130 families (= 10 + 30 + 50 + 40).
Page No: 203
![]()
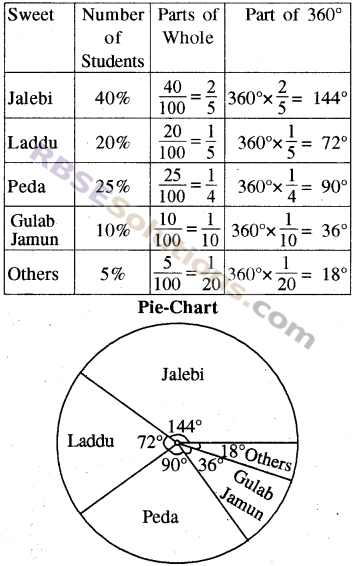
Question 7.
Sweets liked by students of a school is given below
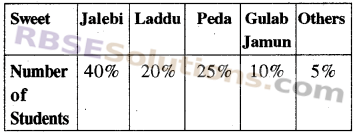
Draw a pie-chart on the basis of data.
Solution
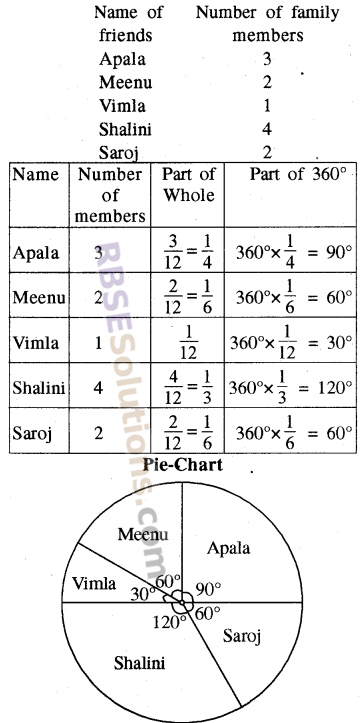
Question 8.
Write down number of members in families of your 5 friends and show it by pie chart
Solution:
Page No: 207
![]()
Question 9.
Fill in the blanks
Solution:
Page No: 208
![]()
Question 10.
When a dice is thrown, what are the possible 6 events?
Solution:
When a dice is thrown, the 6 possible outcomes are 1, 2, 3, 4, 5, 6.
Question 11.
What will be the possible results, when you rotate a wheel? From a list.
(Here result means(RBSESolutions.com)sector at which pointer stops after rotating).

Solution:
The possible results will be P, Q, R and S.
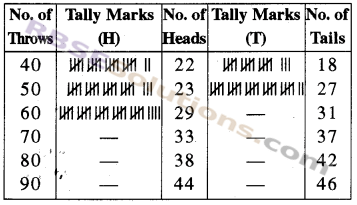
![]()
Question 12.
You have a bag and there are similar balls having different colors. You can draw a ball without looking at this. Write the results obtained.

Solution:
Results are – P,Q,R,S,T,U and V
We hope the given RBSE Solutions for Class 8 Maths Chapter 16 Data Handling In Text Exercise will help you. If you have any query regarding Rajasthan Board RBSE Class 8 Maths Chapter 16 Data Handling In Text Exercise, drop a comment below and we will get back to you at the earliest.